Median Housing Price Prediction
By Heba Mohamed
- 3 minutes readTable of Content
Problem Statements
In a Machine Learning Housing Corporation! The first task you are asked to perform is to build a model of housing prices in California using the California census data.
The model should learn from this data and be able to predict the median housing price in any district, given all the other metrics.
Dataset
The California Housing Prices dataset from the StatLib repository. This dataset was based on data from the 1990 California census. This data has metrics such as the population, median income, median housing price, and so on for each block group in California.
Block groups are the smallest geographical unit for which the US Census Bureau publishes sample data (a block group typically has a population of 600 to 3,000 people). We will just call them “districts” for short.
Tools

- Python 3.
- Pandas Library.
- NumPy Library.
- Scipy Library
- Plolty Library.
- matplotlib Library.
- Sklearn Library.
- Keras APIs.
- Local Jupter Notebook.
- Microsoft Word.
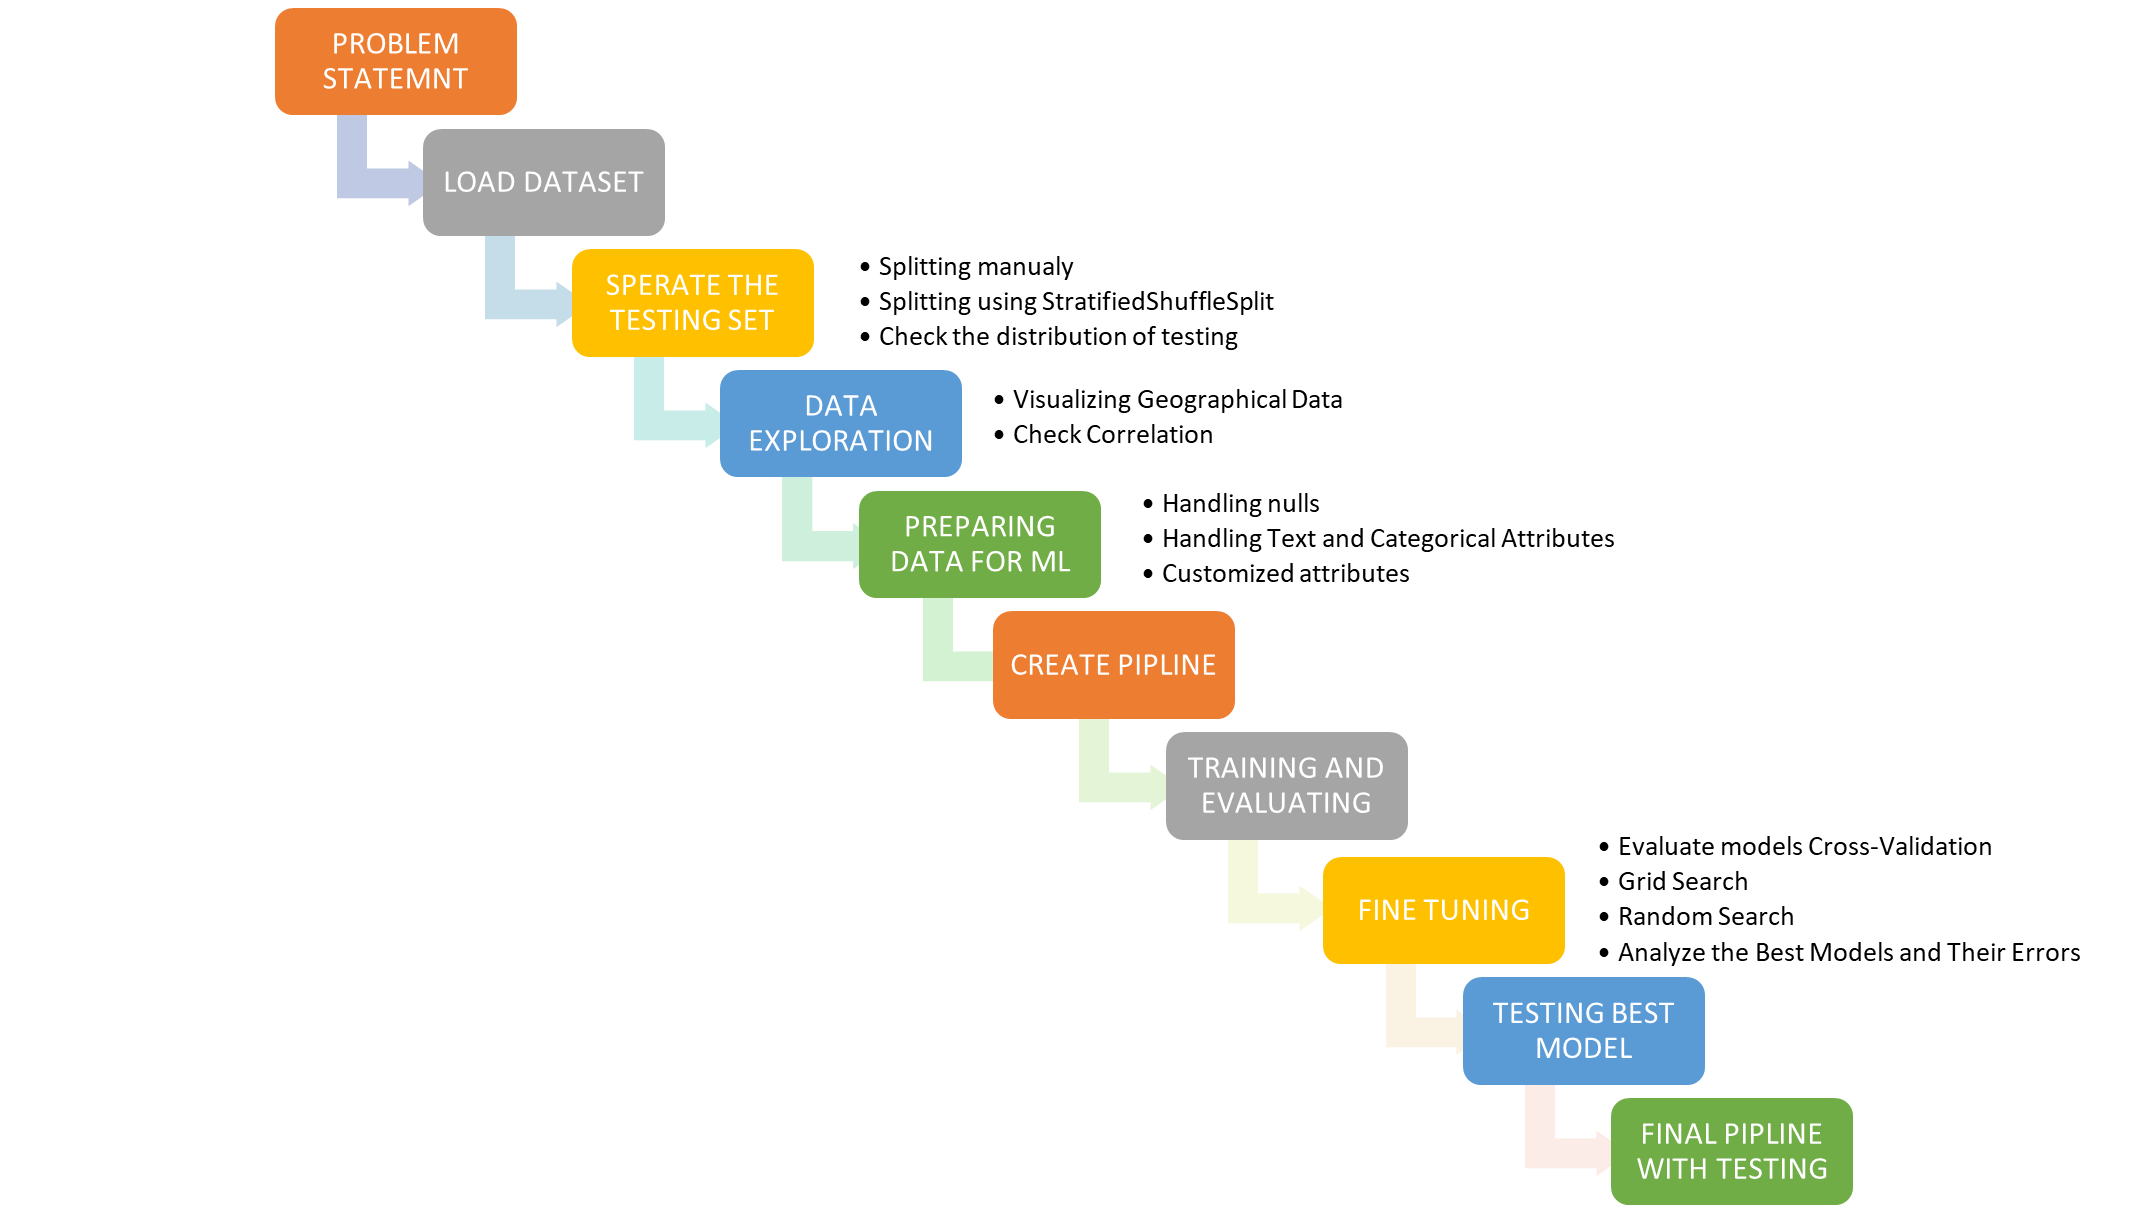
Project Stages
EDA Results
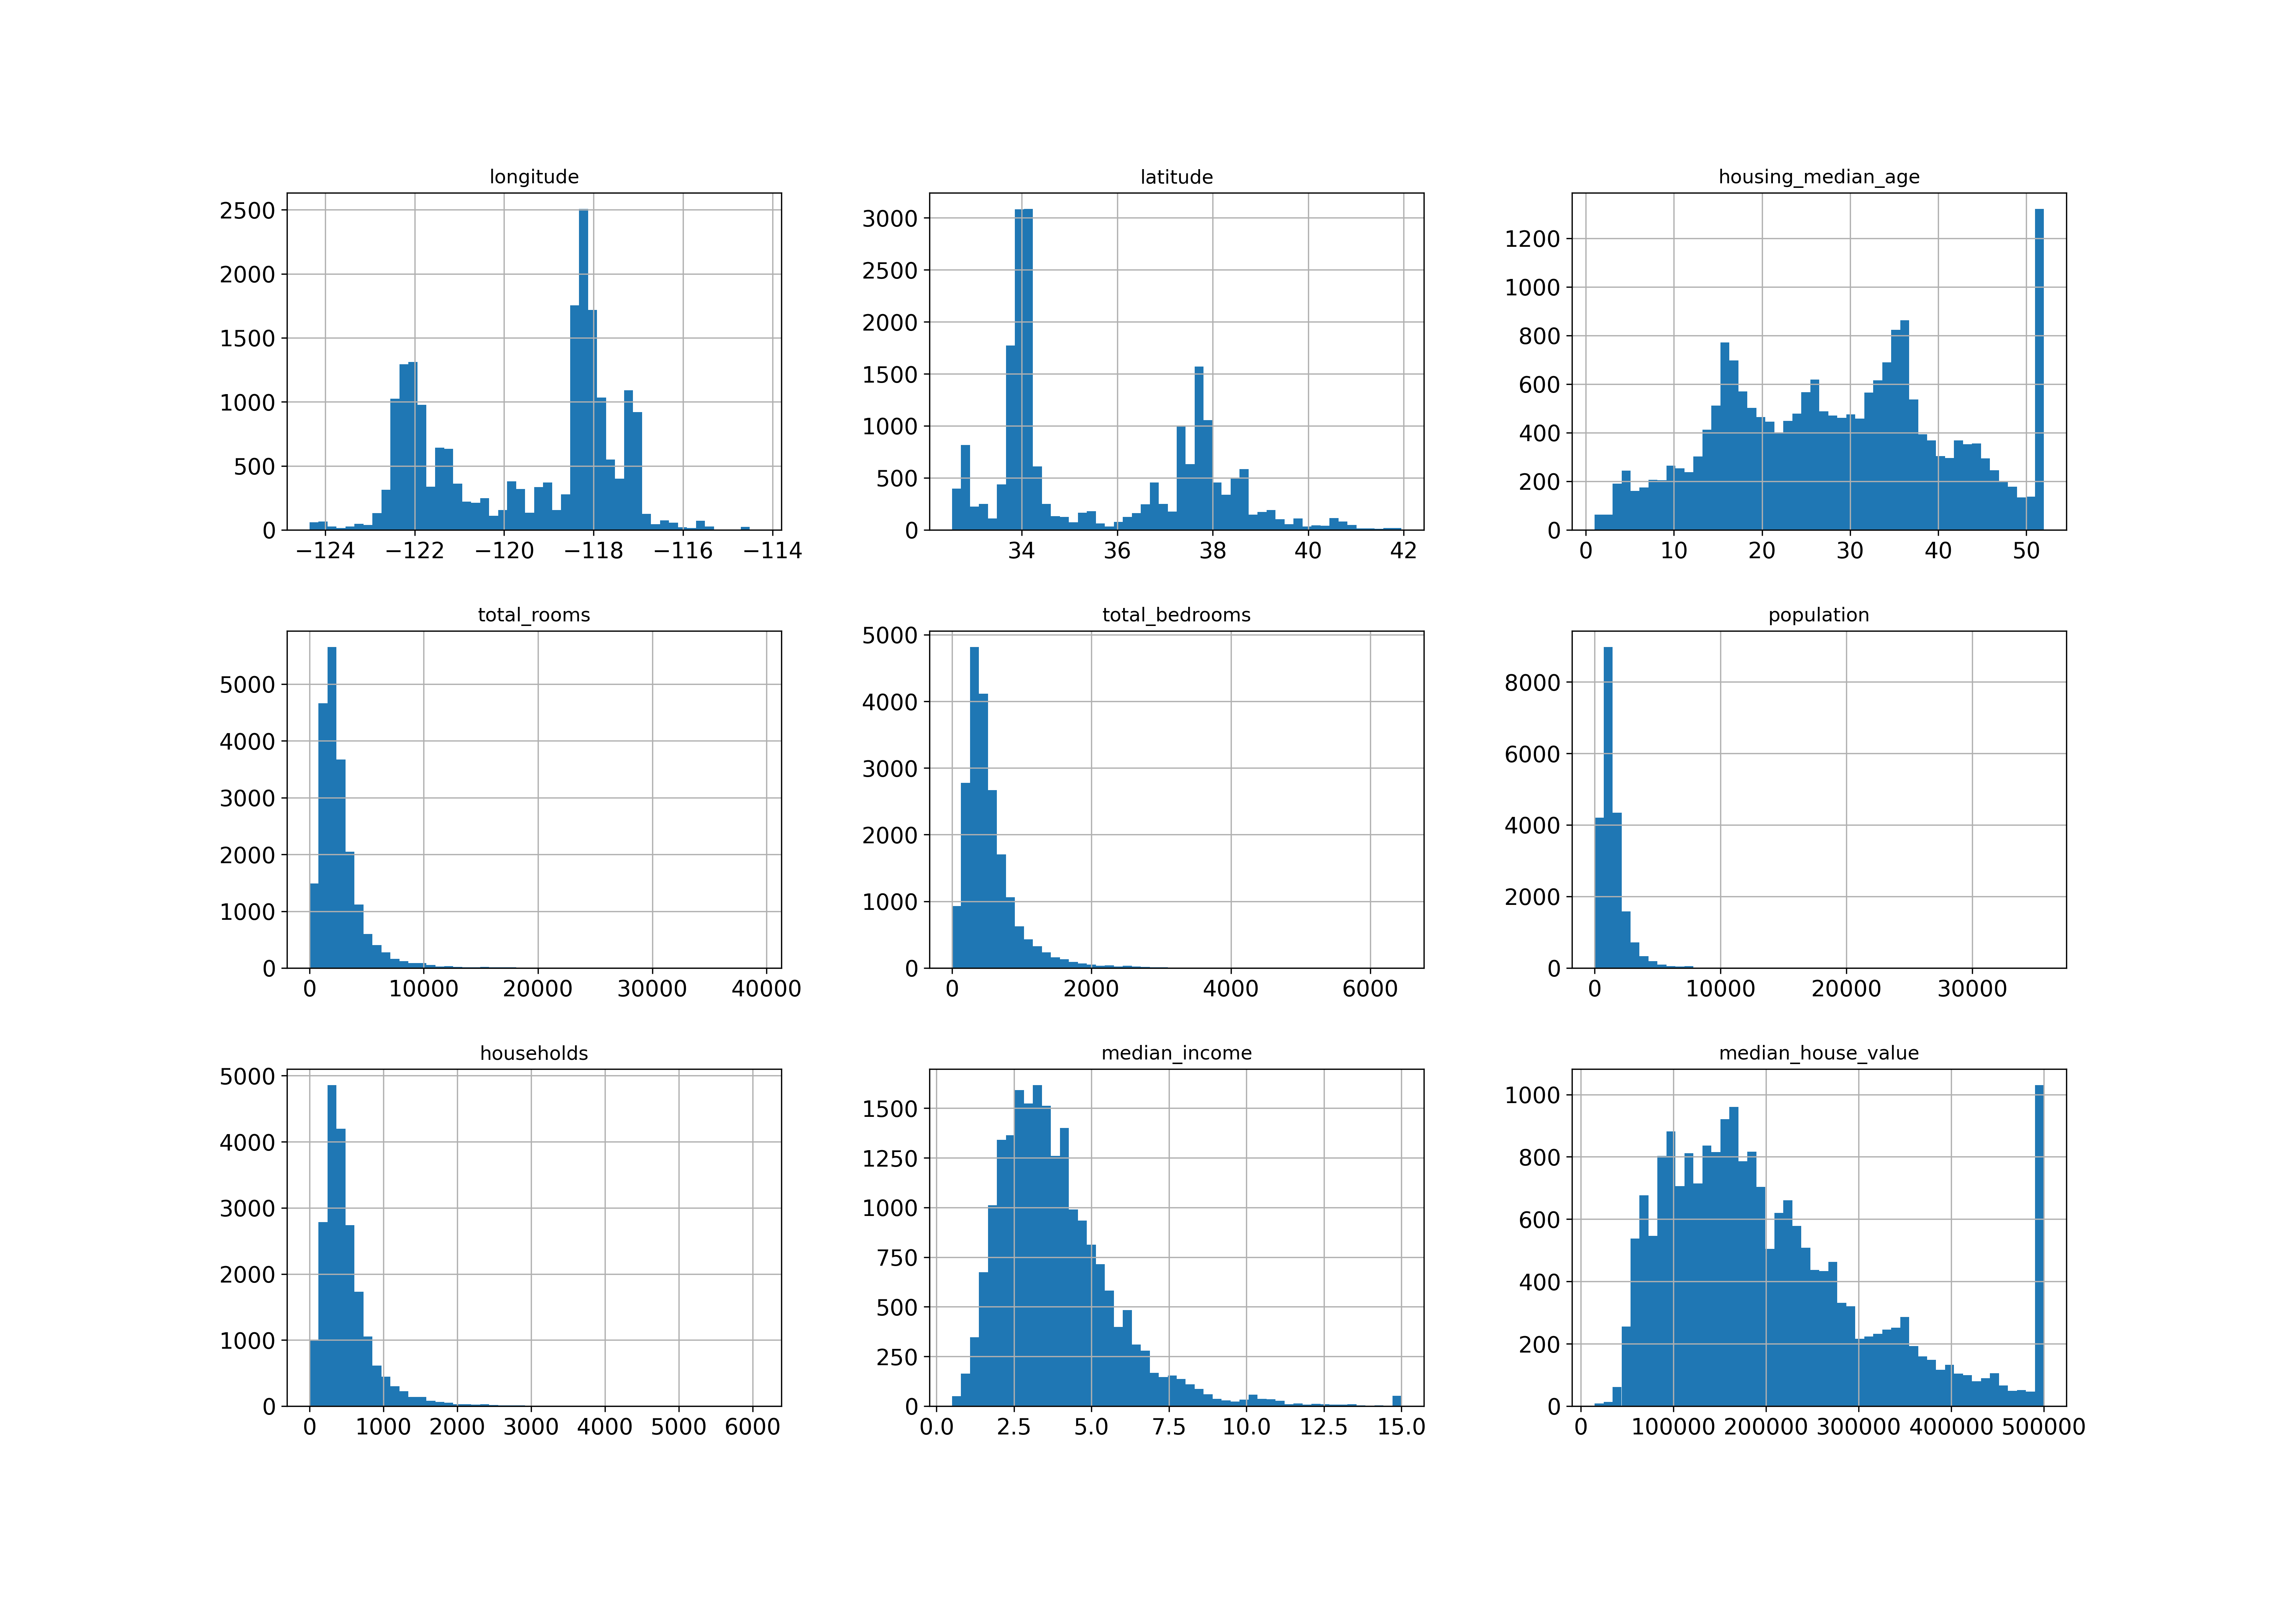
All attributes distrubtions
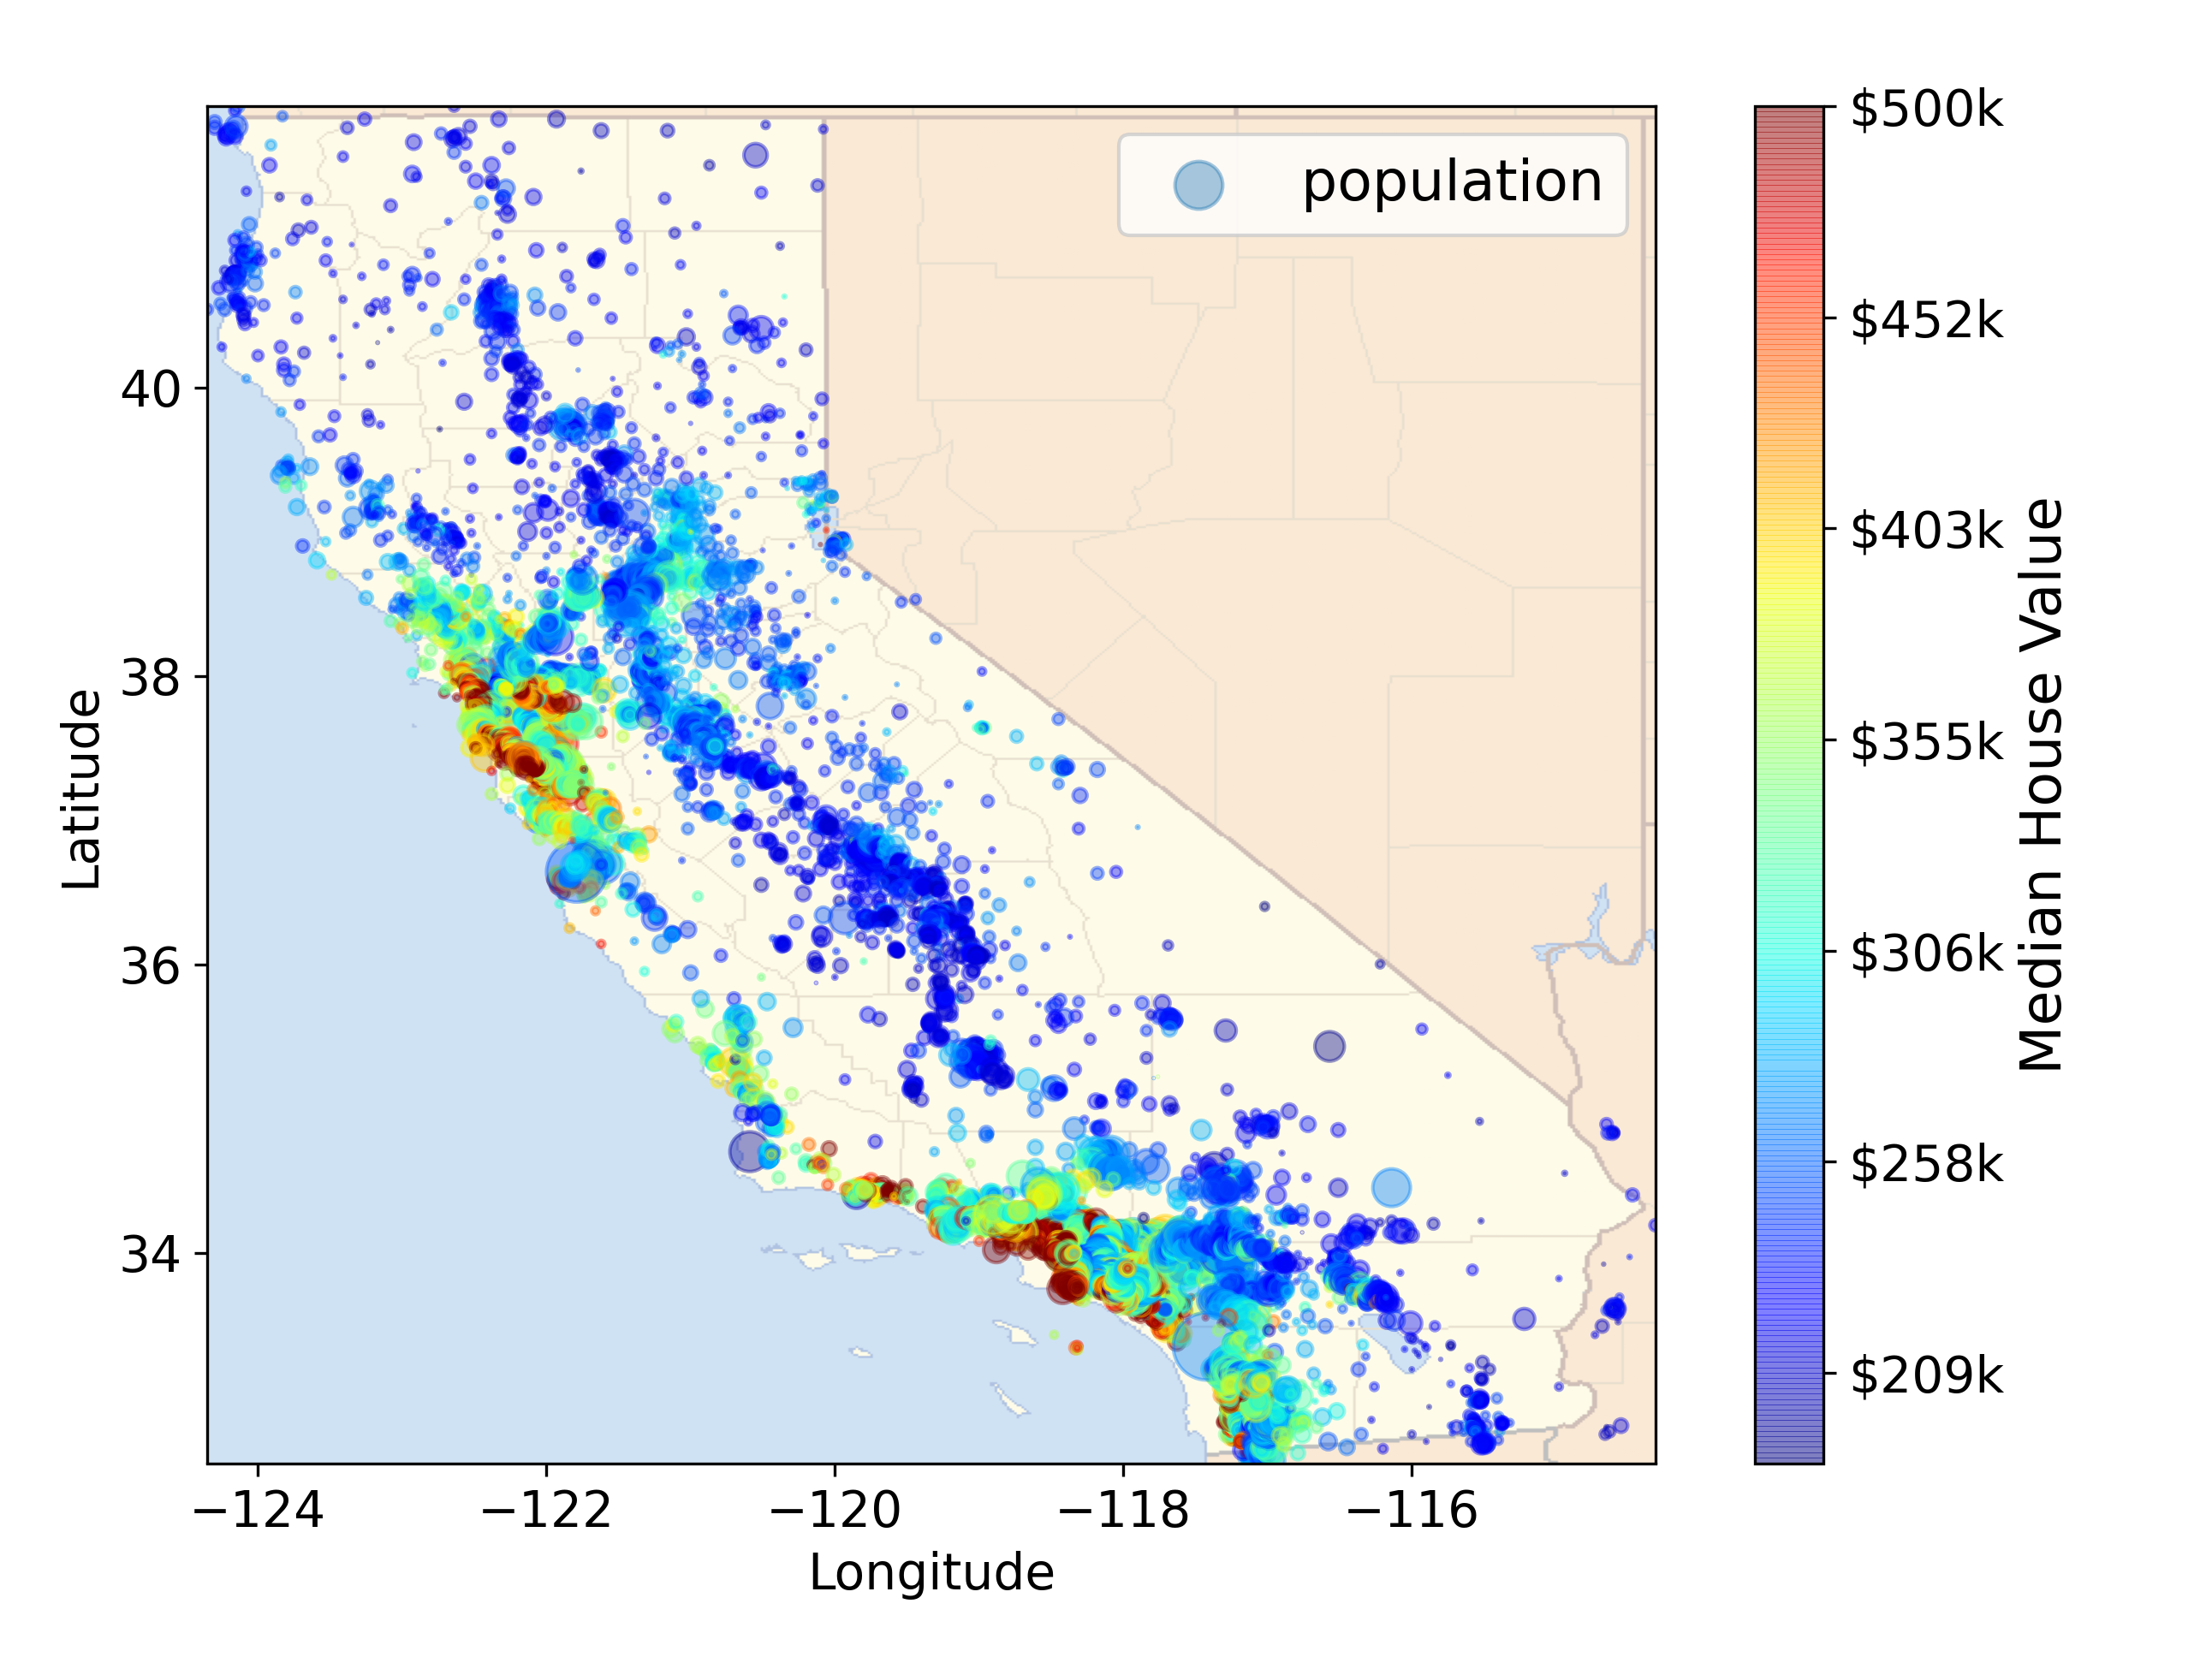
California housing prices on the map
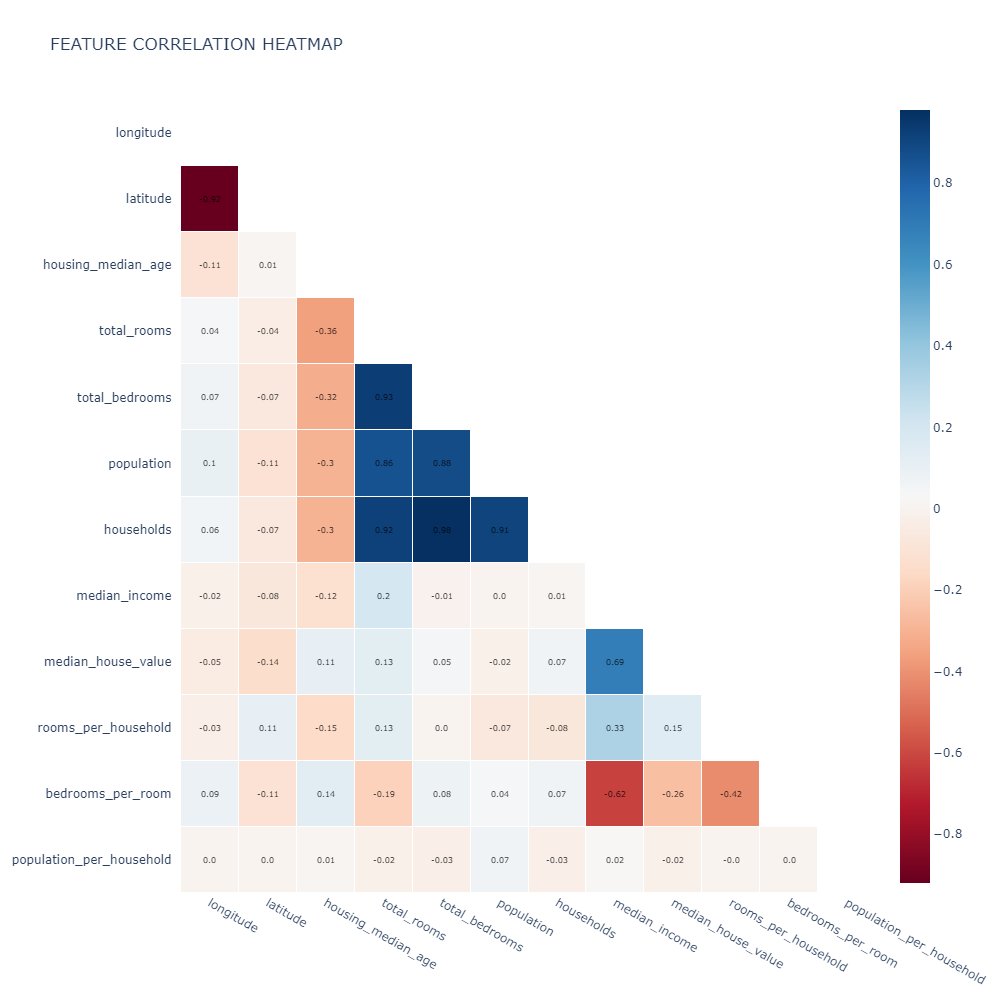
Correlation matrix
Data Modeling
Linear Regression Model
A typical prediction root mean square error of 68,637.14$ is not very satisfying. This is an example of a model underfitting the training data.
Dession Tree Model
A typical prediction root mean square error of 0.00$ .It is much more likely that the model has badly overfit the data.I don’t want to touch the test set until you are ready to launch a model you are confident about, so you need to use part of the training set for training, and part for model validation.
Random Forest Model
A typical prediction root mean square error of 18,762.48$ is very satisfying.
Suport Vector Machine Model
A typical prediction root mean square error of 111,095.07$ is not very satisfying. This is an example of a model underfitting the training data
Fine Tuning
Evaluate models Cross-Validation
-
RMSE of LinearRegression for 1000 cv is: 66,105.64$. It takes 10.46 sec to train the model using 1000 cv.
-
RMSE of DecisionTreeRegressor for 50 cv is: 71,101.80$. It takes 9.82 sec to train the model using 50 cv.
- The Decision Tree model is overfitting so badly that it performs worse than the Linear Regression model.
-
RMSE of RandomForestRegressor for 10 cv is: 50,205.36$. It takes 106.07 sec to train the model using 10 cv.
- Random Forests look very promising. However,the score on the training set is still much lower than on the validation sets, meaning that the model is still overfitting the training set.
Grid Search
Fitting 5 folds for each of 18 candidates, totalling 90 fits. with parameters as follows:
- max_features : [2, 4, 6, 8]
- n_estimators : [3, 10, 30]
- bootstrap : [False]
- max_features : [2, 3, 4]
- n_estimators : [3, 10]
- return_train_score = True
- scoring= ‘neg_mean_squared_error’
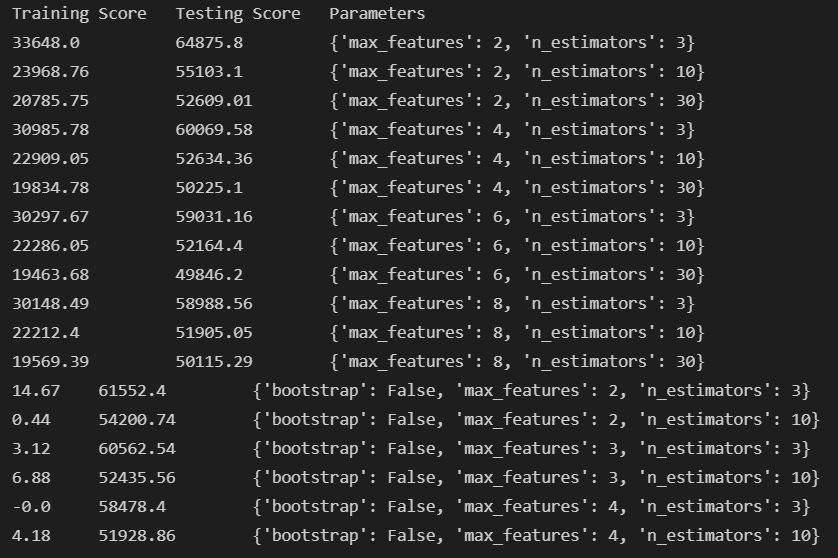
GridSearch results
Best Estimator: RandomForestRegressor(max_features=6, n_estimators=30)
Random Search
- n_estimators: randint(low=1, high=200)
- max_features: randint(low=1, high=8)
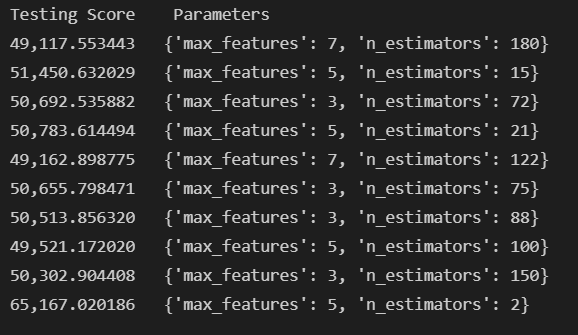
RandomSearch results
Best Estimator: RandomForestRegressor(max_features=7, n_estimators=180, random_state=42)
Best RandomForestRegressor Model Results
- Prediction values : [490149.85, 225712.03, 214206.0, 166142.0, 261910.01, 161073.0, 113634.0, 412596.17, 228043.02, 313987.14]
- Actual values : [500001.0, 162500.0, 204600.0, 159700.0, 184000.0, 151900.0, 104900.0, 500001.0, 367400.0, 346500.0]
- RMSE: 48,442.60$
More Resources
-
For more details see the project repository on github.
-
Easy displaying the project notebook from here