BikeSharing Exploration
By Heba Mohamed
- 2 minutes readTable of Content
Problem Specification
Explore data related to bike share systems for three major cities in the United States—Chicago, New York City, and Washington. I wrote code to import the data and answer interesting questions about it by computing descriptive statistics. I also wrote a script that takes in raw input to create an interactive experience in the terminal to present these statistics.
Tools
- Python 3.
- Time modeule.
- NumPy Library.
- Pandas Library.
- Sublime text editor.
- Spyder IDE.
DataSet
Randomly selected data for the first six months of 2017 are provided for all three cities. All three of the data files contain the same core six (6) columns:
- Start Time (e.g., 2017-01-01 00:07:57)
- End Time (e.g., 2017-01-01 00:20:53)
- Trip Duration (in seconds - e.g., 776)
- Start Station (e.g., Broadway & Barry Ave)
- End Station (e.g., Sedgwick St & North Ave)
- User Type (Subscriber or Customer)
The Chicago and New York City files also have the following two columns:
- Gender
- Birth Year
Interactive Experience
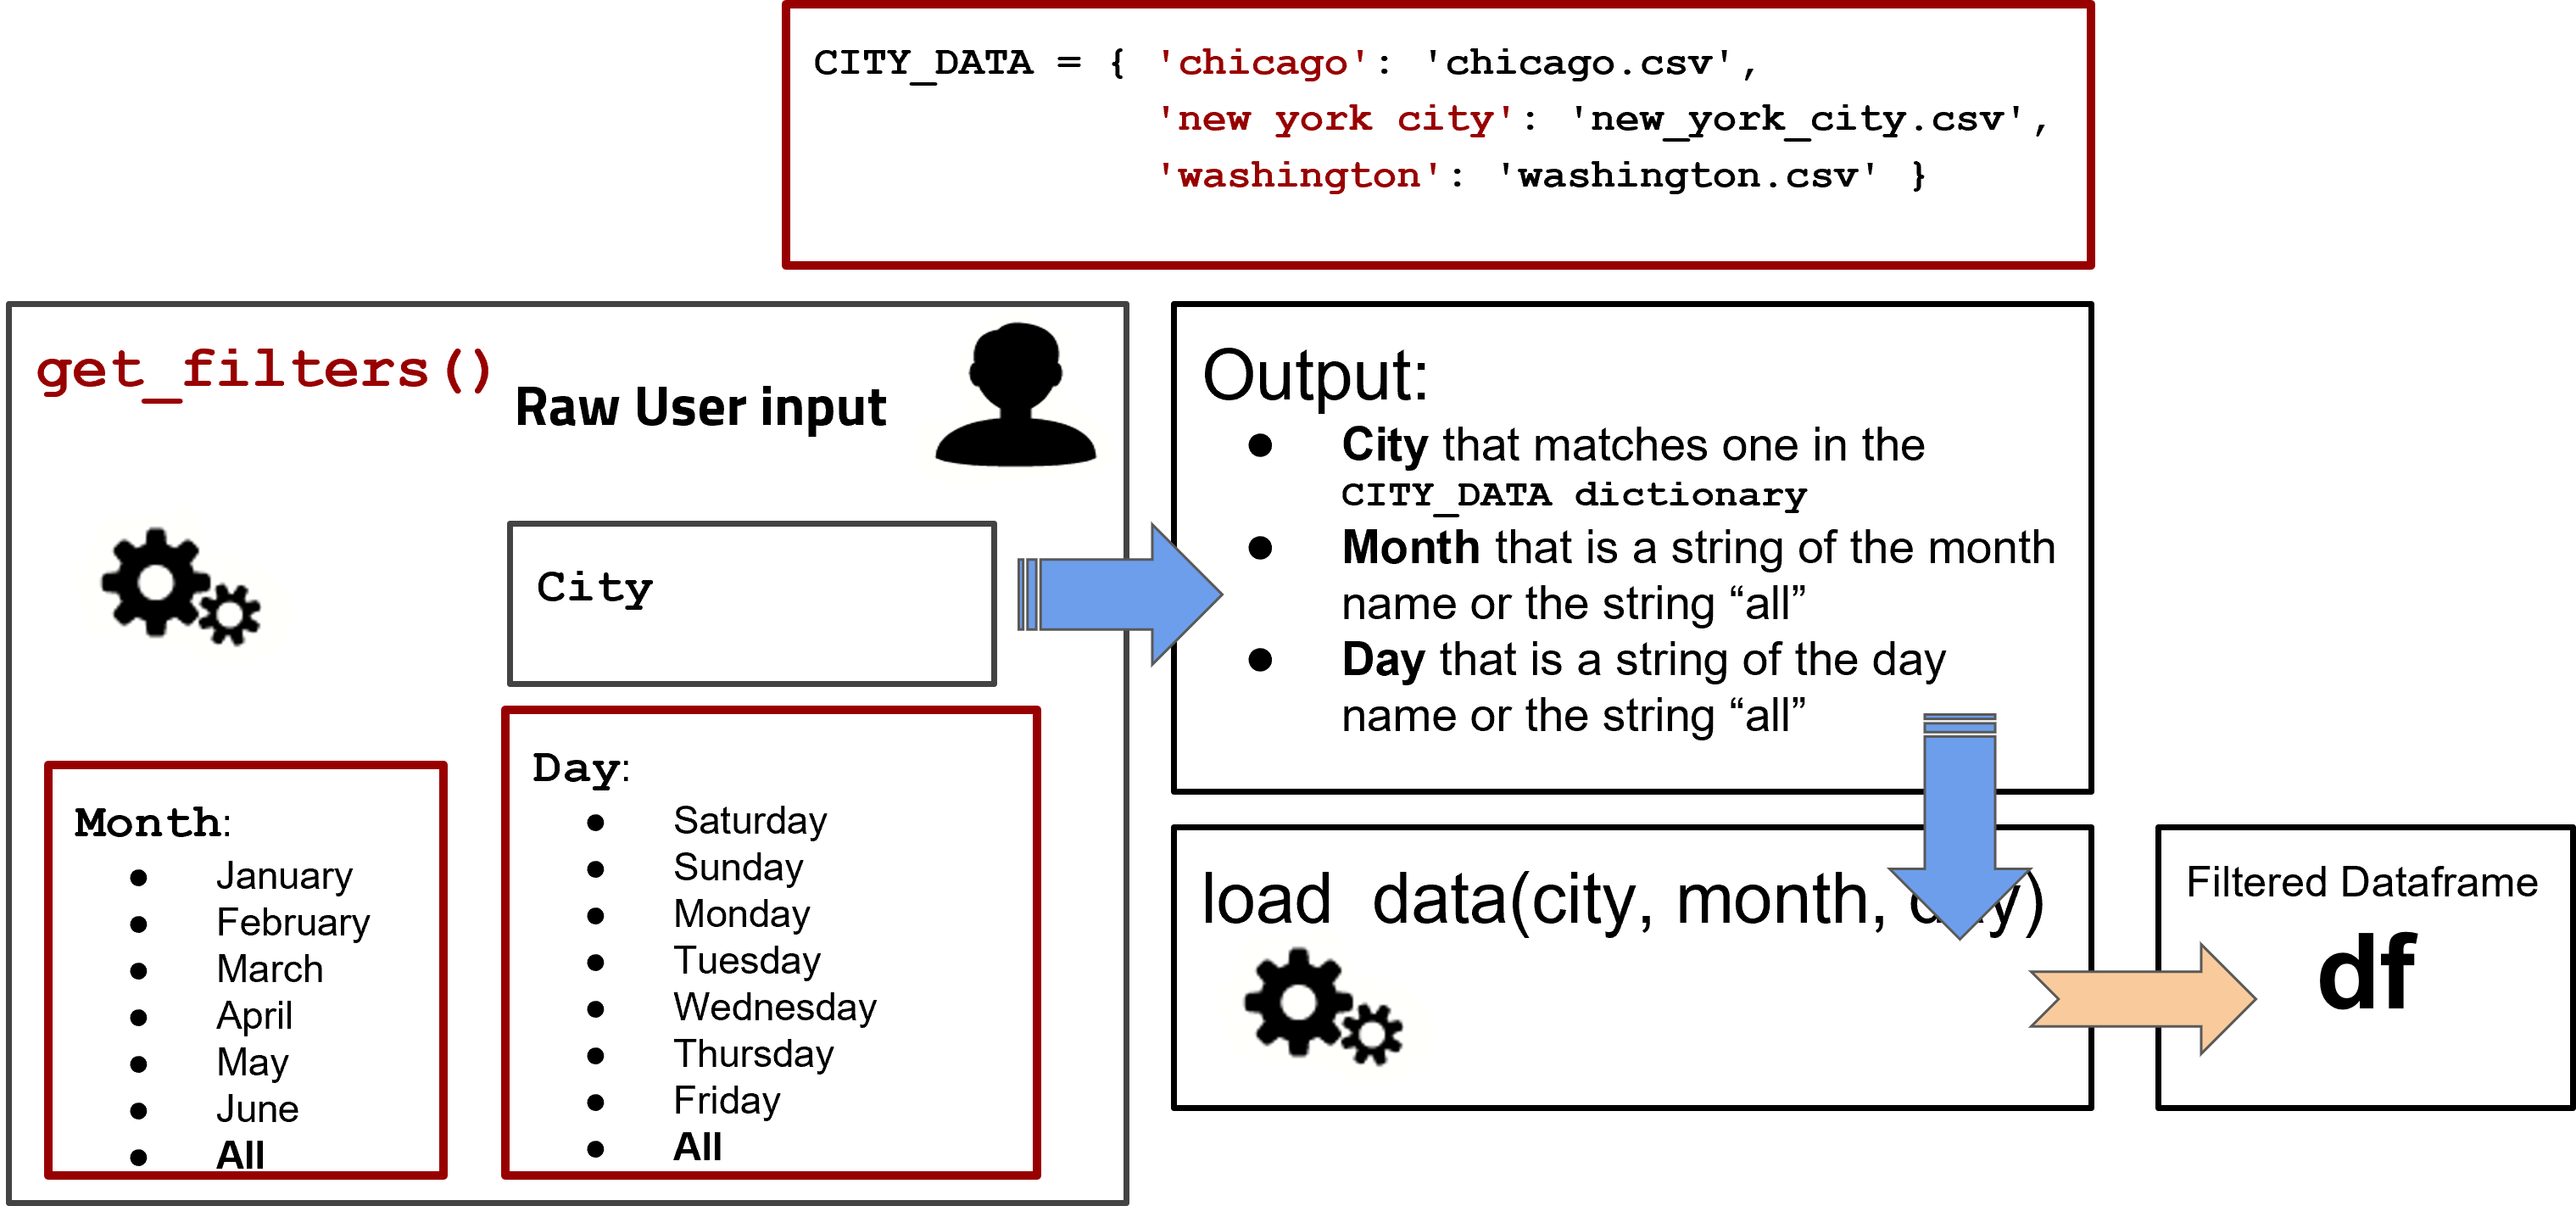
Inputs
Raw input (City - Timeframe - Which month /Which day)
- The City input: Would you like to see data for Chicago, New York, or Washington?
- TimeFrame input: Would you like to filter the data by month, day, or not at all?
- Month input (If they chose month): Which month - January, February, March, April, May, or June?
- Day input (If they chose day): Which day - Monday, Tuesday, Wednesday, Thursday, Friday, Saturday, or Sunday?
Handling unexpected input such as using improper upper or lower case, Typos, and users misunderstanding what you are expecting.
Outputs
Interactive script that answers questions about the dataset.
Statistics Computed
Popular times of travel
(i.e., occurs most often in the start time)
- most common month
- most common day of week
- most common hour of day
Popular stations and trip
-
most common start station
-
most common end station
-
most common trip from start to end
(i.e., most frequent combination of start station and end station)
Trip duration
- total travel time
- average travel time
User information
- counts of each user type
- counts of each gender (only available for NYC and Chicago)
- earliest, most recent, most common year of birth (only available for NYC and Chicago)
More Resources
-
For more details see the project repository on github.
-
You can enroll to Udacity nanodegree.